Devart team is proud to introduce a new product line - ODBC Drivers. We believe we can offer the best features, quality, and technical support for database application developers.
May
19
2015
May
19
2015
Devart team is proud to introduce a new product line - ODBC Drivers. We believe we can offer the best features, quality, and technical support for database application developers.
May
19
2015
Part 1 of 2: (part two)
If you have used MySQL for a while, you have probably used
mysqldump to backup your database. In part one
of this blog, I am going to show you how to create a simple full
and partial backup using mysqldump. In part two, I will show you how to use MySQL Enterprise Backup (which is the
successor to the InnoDB Hot Backup product). MySQL …
May
19
2015
Earlier this spring, we upgraded our database cluster to MySQL 5.6. Along with many other improvements, 5.6 added some exciting new features to the performance schema.
MySQL's performance schema is a set of tables that MySQL maintains to track internal performance metrics. These tables give us a window into what's going on in the database—for example, what queries are running, IO wait statistics, and historical performance data.
One of the tables added to the performance schema in 5.6 is
table_io_waits_summary_by_index. It collects
statistics per index, on how many rows are accessed via the
storage engine handler …
May
19
2015
Recently i have reviewed a simple web application, where problem was with moving “read” count of news from main table to another table in MySQL. The logic is separating counting “read”s for news from base table. The way you can accomplish this task, you can create a new “read” table in MySQL, then add necessary code to news admin panel for inserting id,read,date into this new “read” table, while adding new articles. But for test purposes, i decide to move this functionality to MongoDB. Overall task is -> Same data must be in MySQL, counting logic must be in MongoDB and data must be synced from MongoDB to MySQL. Any programming language will be sufficient but, Python is an easy one to use. You can use Official mysql-connector-python and pymongo. Firstly you must create empty “read” table in MySQL, insert all necessary data from base table to “read” and there should be after insert trigger for …
[Read more]
May
19
2015
Join us Tuesday, June 2nd at 2 PM EST (6 PM GMT), as brainiac Preetam Jinka covers the unique characteristics of time series data, time series indexing, and the basics of log-structured merge (LSM) trees and B-trees. After establishing some basic concepts, he will explain how Catena’s design is inspired by many of the existing systems today and why it works much better than its present alternatives.
This webinar will help you understand the unique challenges of high-velocity time-series data in general, and VividCortex’s somewhat unique workload in particular. You’ll leave with an understanding of why commonly used technologies can’t handle even a fraction of VividCortex’s workload, and what we’re exploring as we investigate alternatives to our MySQL-backed time-series database.
Register for the unique opportunity to learn about time series storage …
[Read more]
May
18
2015
May
18
2015
Amazon Web Services is one of the most popular cloud environments. Galera Cluster is one of the most popular MySQL clustering solutions. This is exactly why you’ll see many Galera clusters running on EC2 instances. In this blog post, we’ll go over five performance tips that you need to take under consideration while deploying and running Galera Cluster on EC2. If you want to run regular MySQL on EC2, you’ll find these tips still useful because, well, Galera is built on top of MySQL after all. Hopefully, these tips will help you save time, money, and achieve better Galera/MySQL performance within AWS.
Choosing a good instance size
When you take a look at the instance chart in the AWS documentation, you’ll see that there are so many instances to choose from. Obviously, you will pick an instance depending on your application needs (therefore you have to do some benchmarking first to understand those needs), but …
[Read more]
May
17
2015
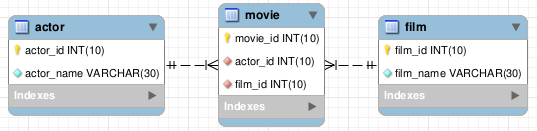
Student questions are always interesting! They get me to think and to write. The question this time is: “How do I write a Bash Shell script to process multiple MySQL script files?” This post builds the following model (courtesy of MySQL Workbench) by using a bash shell script and MySQL script files, but there’s a disclaimer on this post. It shows both insecure and secure approaches and you should avoid the insecure ones.
It seems a quick refresher on how to use arrays in
bash shell may be helpful. While it’s essential in a
Linux environment, it’s seems not everyone masters the
bash shell.
Especially, since I checked my …
[Read more]
May
17
2015
I recently released version 0.1.10 of my library django-mysql, for which the main new
feature was a backend for Django’s cache framework called
MySQLCache. This post covers some of the inspiration
and improvements it has, as well as a basic benchmark against
Django’s built-in DatabaseCache.
TL;DR - it’s better than DatabaseCache, and if you’re using MySQL, please try it out by following the instructions linked at the end.
Why bother?
Django’s cache framework provides a generic API for key-value
storage, and gets used for a variety of caching tasks in
applications. It ships with multiple backends for popular
technologies, including Redis and Memcached, as well as a basic
cross-RDBMS DatabaseCache. The
DatabaseCache is recommended only for …