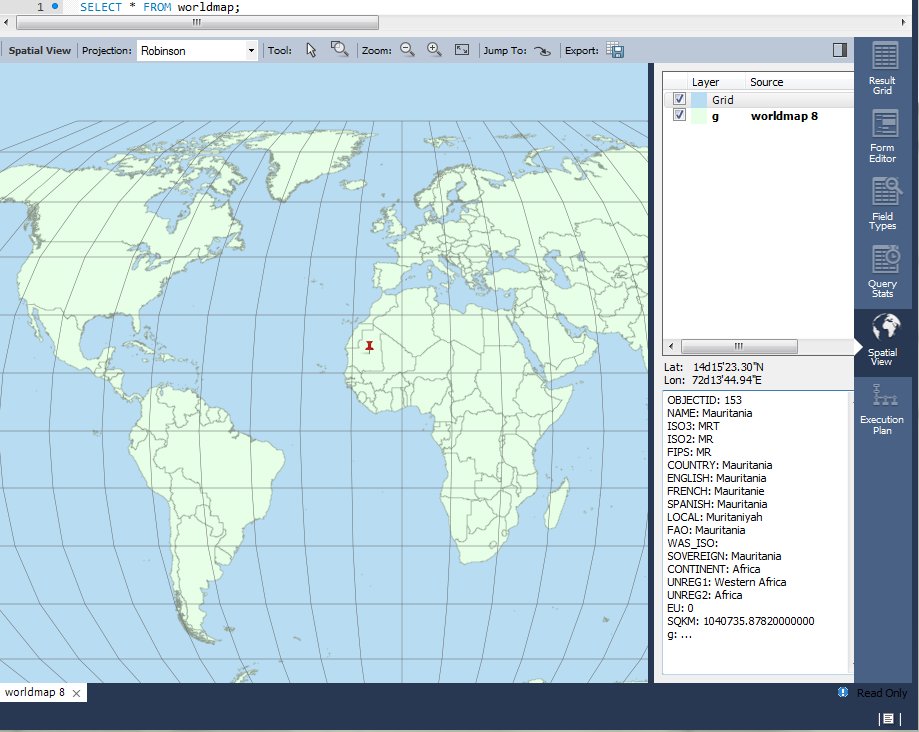
Workbench announced support for a spatial view in 6.2, but examples are somewhat lacking. Just how do you get a SHP into MySQL?
Download and unpack a SHP file such as these country boundaries.
In the Workbench installation directory, you'll find a program "ogr2ogr" that can convert .shp to .csv. Run it like this:
"C:\Program Files\MySQL\MySQL Workbench 6.3\ogr2ogr.exe" -f CSV countries.csv countries.shp -lco GEOMETRY=AS_WKT
Now create a table and load the CSV.
CREATE TABLE worldmap (
        OBJECTID smallint unsigned,
        NAME varchar(50),
        ISO3 char(3),
        ISO2 char(2),
        FIPS varchar(5), …
[Read more]