As shown in previous blogs and technical papers about MySQL 5.6,
MySQL 5.6 improved scalability from 36 CPU threads sockets all
the way to 60 CPU threads on a machine where each socket have 6
cores and 12 CPU threads.
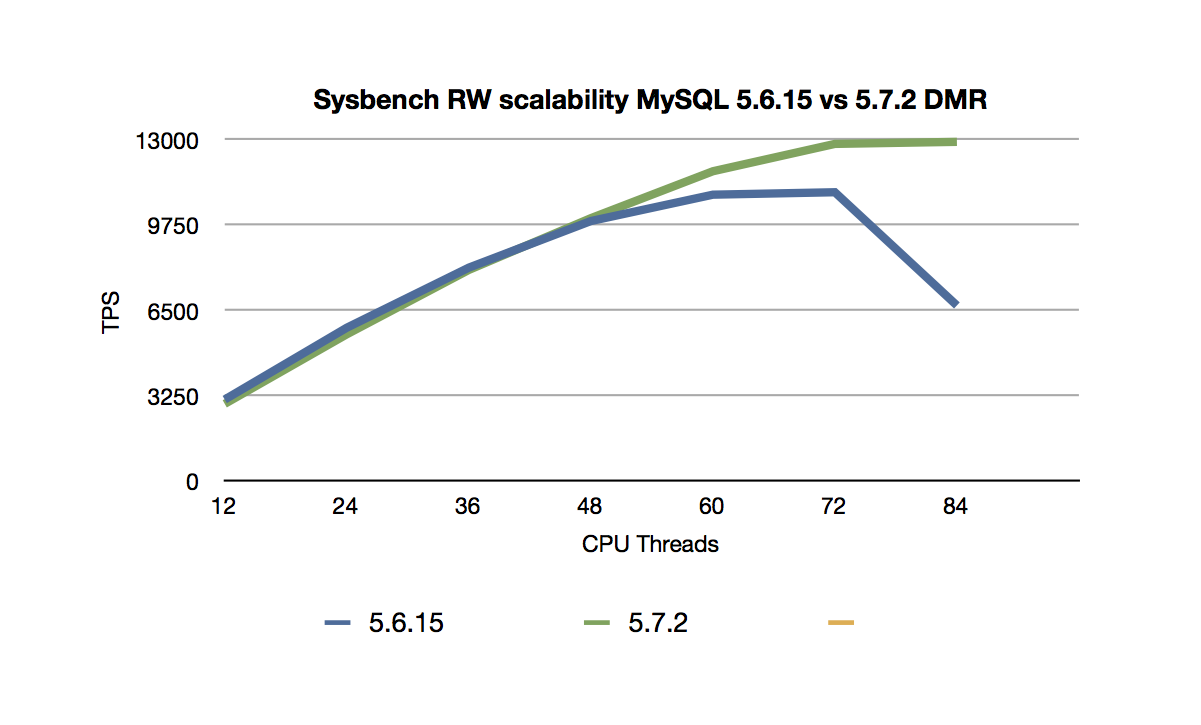
Now that we have released the MySQL 5.7.2 DMR it's interesting to
note that we have improved scaling yet one more step. I performed
a number of simple test runs to see how our scalability have
improved from MySQL 5.6.15 to MySQL 5.7.2 DMR. What the numbers
clearly shows is that we have increased our scalability from 60
CPU threads to 72 CPU threads. Where we previously leveled off
going from 48 CPU threads to 60 CPU threads, we're now leveling
off going from 60 CPU threads to 72 CPU threads and the maximum
performance is now found at 72 CPU threads compared to 60 CPU
threads in MySQL 5.6.
Here we have the graph for scalability improvements of Sysbench
RO.
Here is the graph for scalability improvements
of Sysbench RW.
The reason is a series of improvements, both
in the MySQL Server and in the InnoDB parts. One important thing
is the improvement of the index locking which improves write
scalability since updating indexes now is done with less
concurrency problems. For read only workloads and primary key
reads in particular there have been great improvements in the
area of MDL locking and in this area we have almost doubled the
throughput which is possible for MySQL 5.6 compared to MySQL
5.7.
In my work on scalability I have started using the perf tool
found in modern Linux releases. It's an awesome tool, to get a
complete performance analysis I can simply start perf record and
specify the CPU and PID that I want to track. I can track on
timed events, on first-level cache misses, last-level cache
misses, various forms of TLB misses, branch prediction misses and
much more. This should prove useful also in finding improvements
also for single-threaded workloads. I have already done such
analysis and improvements of the MySQL Cluster data node code and
seen some stunning results. It has taken some time to get to
understand the perf tool however.
The main obstacle with this tool is that the reporting sometimes
points to assembler instructions which are not where the real
issues are. The problem here is that the reporting is very
inaccurate, the reported instruction can sometimes be as much as
several dozens of instructions away from the real instruction
where the bottleneck resides. In the literature this problem is
referred to as skid, if an event occurs then the reported
instruction is the next instruction to restart execution from
after handling the event. Since a processor can have hundreds of
instructions in flight at one point in time, this means that the
skid (the number of instructions between the instruction that
caused the event and the reported instruction) can be hundreds of
instructions. This means that it becomes much more difficult to
use the results from the perf tool. I read some Linux discussions
about this tool and it seems not to be a priority of Linux kernel
developers to do something about this skid problem. So one needs
to remember that the perf output is mostly an indication of where
the problem resides and no more.
Sep
30
2013